Cut Your Energy Bills - Start Today.

2,000+ Solar Installs Completed in the North East.

CALL 0191 340 7001

Wet Leakage Resistance Development of Modules with Various Backsheet Types


Abstract

Over the last years, a significant number of inverter shutdowns most likely due to degraded backsheets have been reported by operators, investors, and manufacturers. We investigated water ingress into different backsheets, and the resulting risk for inverter shutdowns. For studying pending insulation issues of inverters, we analysed a 5-MWp photovoltaic (PV) power station with 20,530 PV modules and 314 inverters exemplarily. For backsheet identification on-site near-infrared absorption spectroscopic measurements of 518 PV modules from 20 inverters were carried out. In the lab, wet leakage tests provide kinetic data of insulation resistances for different backsheet materials. Historic ground impedance data logged by the inverter were evaluated to show the temporal evolution of inverters with different backsheets. We observe different kinetics and drops in leakage resistance for different backsheet types based on polyamide (PA) and air-side fluorinated coating (FC), and distinguish between two types of behaviour. “PA-like” is characterised by moderate leakage resistance loss and slower performance reduction with regard to insulation in the field. “FC-like” is characterised by high susceptibility to water and a high leakage resistance loss rate for PV modules after 6–8 years of operation. These characteristics are indicated when measuring inverter GI in dependence of temperature and humidity. For PA-based BSs, the reduction in ground impedance (GI) is steady over 8 years. We observe incidences with GI below the critical value of 400 kΩ on 2.8% of all days. For FC-based BSs, we also observe steady decrease of average GI initially, yet after 6 years in the field, we see a sudden and rapid decline for 20% of those inverters. GI falling below the critical value is observed on up to 5% of all days, with the trend increasing. Therefore we, expect this problem to become even more severe for longer operating times.

Abbreviations

  • AH
  • absolute humidity
  • BS
  • backsheet
  • DF
  • double fluoropolymer
  • FC
  • coating of fluorinated copolymers
  • GI
  • ground impedance
  • LC
  • leakage current
  • LR
  • leakage resistance
  • LR′
  • leakage resistance loss rate
  • LR0
  • leakage resistance at t = 0
  • LRthres
  • leakage resistance threshold (here 28 MΩ)
  • NF
  • non-fluoropolymer
  • NIRA
  • near-infrared absorption
  • PA
  • polyamide
  • PE
  • polyethylene
  • PET
  • polyethylene terephthalate
  • PP
  • polypropylene
  • PV
  • photovoltaic
  • PVDF
  • polyvinylidene fluoride
  • PVF
  • polyvinyl fluoride
  • Raman
  • Raman spectroscopy
  • RH
  • relative humidity
  • SF
  • single fluoropolymer
  • T
  • temperature
  • t
  • time
  • ρX,Y
  • Pearson's correlation coefficient between X and Y
  • 1 INTRODUCTION

    Degradation of backsheet (BS) materials reduces the performance and lifetime of photovoltaic (PV) modules and PV power stations. About 50% of German PV power stations (total capacity in 2020: 52 GWp) and 10% of worldwide PV power stations (2020: 770 GWp) approach half of their expected lifetime of 20 years. Operators and experts report multiple BS-related issues of PV modules, most likely due to BS degradation over the years. There are external, visible signs of degradation; PV modules exhibit macroscopic cracks, peeling, corrosion, delamination, discolouration, blistering, burn marks, and so forth. Dupont stated in their report from 2020 that a significant number of PV modules, 16% form 9 million analysed PV modules, have BS defects.

    BS degradation may coincide with water ingress into the BS causing potentially high leakage currents and insulation issues. These insulation issues, in turn, may affect the ground impedance measured at inverter level. If ground impedance falls below the threshold for safe operation of 400 kΩ the inverter does not connect to the grid. Thus, degraded BSs can cause inverter shut-offs and reduce the income for PV plant owners.

    Little is known about the dynamics of this process and its relevance in the field. Existing studies focus mostly on the chemical analysis of the degradation state of the PV module polymer components, for example, on crack formation in PA-based BSs due to missing or reduced additives (e.g., UV absorber). In accelerated lab tests, specific ageing factors are analysed for simulating environmental operating conditions. A more recent approach uses fully convolutional neural networks to explain BS degradation. First studies have been reported that bridge the gap between accelerated aging test in the lab and natural degradation in the field. These studies comprise single observations though and lack the combination and transformation of the individual results to operating conditions in the PV power stations.

    We address this issue by exploring how leakage resistance is affected when PV modules are subjected to water ingress artificially in the lab, and we investigate how this effect plays out for PV modules in the field at operating conditions. We investigate PV modules with BS from three main BS classes:

    1. - double fluoropolymers (DF) BSs with a polyethylene terephthalate (PET, thickness of 235–240 μm) core between two layers of fluorinated polymers (polyvinyl fluoride [PVF], 25–30 μm), polyvinylidene fluoride (PVDF, 25–30 μm), or fluorinated copolymer coating (FC, 5–10 μm),
    2. - single fluoropolymer (SF) BSs with a PET-core (160–330 μm), a fluorinated air layer (PVF, PVDF, and FC) and polyethylene (PE, 50 μm) or polypropylene (PP, 140 μm) inner layer, and
    3. - non-fluoropolymer (NF) BSs, composed of one or many layers of the same non-fluorinated polymer, in particular polyamide (PA, 350–400 μm), PET (100–120 μm), or PP (200 μm) with TiO2-enriched air and inner layers.

    Water ingress into the BSs was determined using suitable near-infrared absorption (NIRA) spectroscopy. To explore potential correlation between water ingress in the BS and kinetics of leakage resistance of PV modules, we carried out time-series of wet leakage tests. We find that all BSs are susceptible to this issue, yet that there are differences as to how much they are affected. For studying the relevance of this effect of BS-dependent water susceptibility on field operation, we analysed field data. These field data include on-site identification of BSs using NIRA, correlating historic GI data (corresponding to inverters of the measured BSs) with publicly available weather data. Pearson's correlation coefficient confirms the differing water susceptibility of the BS materials. As a result, we find that with degrading BSs, GI can drop below the critical value of 400 kΩ.

    With this work, we highlight the relevance of the BS material causing insulation issues and the resulting consequences for PV power station performance. The presence of insulation issues and ground faults is of importance for investors, because safety issues and inverter shutdowns interrupt grid connections and reduce revenue. Better understanding of how polymer components (BS and encapsulant material) degrade under operating conditions, and how this affects PV modules and inverters is urgently needed.

    2 EXPERIMENTAL APPROACH

    2.1 Description of the initial situation and prior-knowledge

    Our field analysis was carried out at a 5-MWp PV power station commissioned in 2012 and located in Eastern Germany. Installed PV modules were from a single tier-one manufacturer with power classes ranging from 225 to 260 W. We indicate PV modules of different power classes as Types A to G (Table 1). Different combinations of these module types are found across inverters (Table 2). For quality control, a portion of the PV modules was characterised in more detail, as described elsewhere. For this work, the BS characterisation using NIRA is of importance. BS compositions of 518 PV modules, 2.5% of the total installation, and belonging to 20 inverters were characterised. Several different BS types were identified for each module type. According to our analysis, PV modules of type G have mostly PA-based BSs (94%), and modules of Types D and E exclusively have SF-BSs (64% FC-based BSs, 6% PVF-based BSs, and 30% PVDF-based BSs).


    TABLE 1.

    Distribution of the installed PV module power classes in increasing order

    Module type A B C D E F G Total
    installed PV modules 250 5600 100 6400 6,800 100 1500 20,750

    TABLE 2.

    Association of inverter configurations with installed module types and the numbers of inverters

    Inverter configuration I II III IV V VI VII VIII Total
    Module types C D B + D E F G A + B + G B + F
    # of inverters 1 24 152 96 1 27 11 2 314

    Note: All investigated inverters are from the same type of 15 kW.

    Table 3 summarises the BS materials for PV modules and associated inverter configurations. This is of importance because many inverters operate (mpp-tracking) more than a single PV module power class. Please note the frequently found combination of PV Modules B and D. Inverters with Modules A, C, and F are included for completeness but are of lower relevance because of the small number of installed PV modules and inverters.


    TABLE 3.

    Distribution of the identified BS material per inverter configuration, and six exemplarily discussed and addressed inverters throughout the paper, invA to invF

    Inverter configuration I II III IV V VI VII Total
    # of inverters with analyzed BSs 1 2 4 2 1 9 1 20
    BS material
    DF_BS 0
    SF-BS (FC-based) 91% 39% 83% 56% 4% 18% 164
    SF-BS (PVDF-based) 9% 12% 17% 44% 1% 63% 50
    SF-BS (PVF-based) 39% 49
    NF-BS (PA-based) 100% 94% 255
    Examples of inverters invD invC invA
    invF invE invB

    Note: For invB exclusively PA-based NF-BSs were identified, while invA is an example for PA-based NF-BSs mixed with some FC-based SF-BSs. Furthermore, the total number of inverters and PV modules for which the BS material was analysed is given.

    Furthermore, the field inspection revealed that at least 60% of PV Modules G (with PA-based BS) show plenty of macroscopic cracks behind the busbars. PV Modules D and E with various types of SF-BS exhibit no macroscopically visible abnormalities and changes of the BS. However, microscopic crack structures in the inner layers of FC-based BSs became visible in close-up images.

    The diversity of the BSs within one module type is also reflected at the inverter level. On-site NIRA-measurements confirm at least two BSs for one PV module type connected to one inverter. In extreme cases, as many as six BS types per inverters were identified.

    2.2 Wet leakage resistance/current test and NIRA-measurements

    Tests in the lab were performed on BS cross-sections cut from discarded PV modules. Among the analysed BSs were unused replacement PV modules as well as field-aged PV modules (6–8 years in operation). PV module investigation included infrared spectroscopic (Raman and NIRA) identification of the BS material and layout as well as water ingress, module IV-measurements to determine the electrical performance, and leakage resistance/leakage current (LR/LC) measurements to ensure proper operational readiness.

    The LR (LC) values were measured according to the standard wet leakage current test. However, for studying temporal changes and the kinetics of LR, the PV modules were immersed for several days in the electrolyte-enriched water bath. They were examined at regular intervals during the soaking and drying stages. In parallel, NIRA spectra were recorded from the module air-sides and evaluated for identifying water ingress.

    2.3 Field analysis using monitoring data

    In order to study the potential changes in the leakage resistance, ground impedance (GI) values measured by the inverters was used. For data analysis, the minimum GI of each inverter was evaluated throughout the 2891 days (corresponds to 8 years) of operation recorded. Thanks to prior-knowledge and on-site NIRA BS-characterization for 20 out of 314 inverters, for most modules, it was known which BSs were used.

    Furthermore, publicly available weather data, especially ambient temperature (T), relative humidity (RH), and absolute humidity (AH), were processed. Because the measured GI values rarely changed within 1 day, daily averages were calculated for each parameter. Parameters include ambient temperature, relative humidity, and absolute humidity. The time series of each parameter was then correlated with the ground impedance time-series of the different inverters.

    3 RESULTS

    3.1 Leakage resistance

    Starting LRs (LR0 at t = 0) of field-aged PV modules as well as of new or spare PV modules from the same type were measured immediately after immersing the PV modules into an electrolyte bath. For field-aged PV modules LR0 depends strongly on the BS material and composition. PV modules with DF-BSs have the highest LR0 of 600–800 MΩ, for those with FC-based SF-BSs LR0 = 100–200 MΩ was measured, and for ones with PA-based NF-BS resulted LR0 = 200–300 MΩ. PV modules with DF-BSs originate from a different PV power station than the one from which the remaining modules were taken. PV modules with DF-BSs came from the same manufacturer as the other modules and served as comparison. For new or spare PV modules for replacement purposes, LR0 as high as 1 GΩ was measured. In general, unused PV modules showed up to ten times higher LR0 values than field-aged PV modules.

    Besides the static LR, we measured the kinetics of LR of field-aged PV modules with FC-based and PA-based BSs. For this purpose, PV modules were left immersed in aqueous electrolyte (2 v.% of ionic surfactant Liquinox©) for many days (up to four weeks) and LR was measured regularly. Figure 1 shows the LR-values normalised to LR0 for representative PV modules with different BS types. For the first 6 h in the electrolyte bath, LR drops strongly; afterwards, it stabilises on a material-dependent level.


    FIGURE 1: Measured wet leakage resistance for field-aged PV modules with BSs from different BS-classes, DF-BS, SF-BS: FC-based BS, NF-BS: PA-based BS, normalised leakage resistance loss rates for field-aged PV modules with different BS-types

    The LR loss rate (LR′) was obtained from linear regression within the first 3–4 h when LR shows a roughly linear decay behaviour. Figure 1b shows LR′ normalised to LR0. Depending on the BS material, the kinetics of LR changes differs notably. LRs of DF-BS modules drop slowly and to a low extent during electrolyte immersion and remains on a high level of 82% of LR0. The rate of insulation loss of PA-based NF-BS is moderate, LR dropping typically to 25–35% of LR0 in the first hours of immersion. The risk for reaching threshold LR values exists for modules with originally low LR0.

    LR of FC-based SF-BS drops very fast and approaches frequently values below 10 MΩ, while the LR′ is high. If LR0 has already been strongly diminished during the years of operation prior to our tests, LR approaches zero very fast or falls below the crucial value of 40 MΩm2 (standard, corresponds to LRthres. = 28 MΩ for a standard 1.5-m2 60-cell PV module) which will impede proper inverter operation and connection to the grid.

    With our kinetic leakage resistance/current tests, we focused on the investigation of changes in the BSs. At that, in several cases the tests needed to be stopped due to failure of the junction box, especially for PV modules with DF-BSs and in about 20% of the tests for PV modules with FC- or PA-based BSs.

    We note, however, that the details of the mechanisms and kinetics of the degradation of the PV module insulation induced by water ingress are still to be explored and understood. From the leakage test for functional PV module (LR > 15 MΩ), we observed that soaking a PV module for 1 h, LR will be reduced by 20%–30% of LR0 for FC-based SF-BSs, 5%–10% of LR0 for PA-based NF-BSs, and 1%–5% of LR0 for DF-BSs.

    NIRA spectroscopy enables the non-destructive identification of chemical composition and architecture of BSs, as well as the presence of water. Water is a known stress factor for polymer degradation, and water ingress can cause leakage current.

    Figure 2 presents NIRA spectra of three types of BS studied in the present work and visualises the water ingress at prolonged soaking in the electrolyte bath as well as water evaporation upon subsequent drying of the PV modules.


    FIGURE 2: Normalised NIRA spectra of NF, SF, and DF BSs measured from the airside before the immersion into the electrolyte bath, after 264 h of immersion, and after a shorter period of drying

    The structures of NIRA spectra depend on the BS type and show multiple bands characteristic for different functional groups of the polymer components, including a PA-characteristic C–N–H vibration band at 2040–2050 nm, PET-characteristic = C–H vibration bands at 1660 nm and 2100–2200 nm as well as non-characteristic –C–H vibration bands at 1710–1730 nm. The PET-based SF and DF BSs also show a water-related peak at 1910 nm which can be used for evaluation of the water content in the polymeric BSs. In the case of PA BSs, the water-related peak is broadened, most probably reflecting different water adsorption modes for this material. The magnitude of the water-related band increases upon immersion of the PV modules in the electrolyte bath and decreases again after drying.

    Water ingress and evaporation can be quantitatively followed by calculating the ratio of integral intensities of the water-related band at 1890–1940 nm and the polyolefin band at 1700–1730 nm taken as a reference. Upon the immersion of a PV module into the electrolyte bath, this ratio increases rapidly with time, indicating rapid water ingress within the first hours of immersion, followed by saturation at longer electrolyte exposures (Figure 3a, squares 1). Simultaneously with increasing water content, an increase in LC is observed (Figure 3a, circles 2). Both parameters show the same character of time dependence allowing directly associating the loss of insulation of the immersed PV modules with the water ingress into the BS materials.


    FIGURE 3: (a) Water content determined by NIRA (1) and relative leakage current (LC/LC0, where LC0 is LC at t = 0) as functions of the immersion time, (b,c) Kinetic curves of water ingress upon the immersion of PV modules with different BS types (b) and water evaporation at subsequent drying of the modules (c)

    The susceptibility to water depends on the BS type, it is most strongly pronounced for FC-based SF-BSs and less for PA-based NF-BSs and DF-BSs (Figure 3b). PV modules with FC-based BSs absorb and release water fast. The very thin FC-based air layer of the BS (thickness ≈ 5–10 μm) is probably an insufficient protection for the PET-core against water penetration. Thus, repeating the soaking procedure with interim drying periods reveals that the previous starting LR0 is reached again.

    The initial water evaporation rate is much higher than the ingress rate and shows only a marginal dependence on the BS type (Figure 3c). At the same time, the NF-, SF-, and DF-BSs showed considerable differences in terms of residual water observed after longer evaporation times. The FC-based SF-BSs recover to a much deeper extent revealing only about 15% of residual water after 24 h drying, while PA-based NF-BSs and DF-BSs show about 40% and 55% of residual water still present in the same drying conditions (Figure 3c).

    3.2 Monitoring data analysis in correlation with weather data

    For providing operational readiness, inverters need to ensure ground impedances above 400 kΩ. The logged GI values are as high as 60,000 kΩ in the early years and as low as 200 kΩ after 5–6 years of operation observed for individual inverters. First, GI values fell, and second, GI variance increased significantly throughout the years. Furthermore, seasonal effects become more pronounced. Although the divergence between the inverters is huge, there are common features within certain groups. The data in Figure 4 show that there is a minimum GI limit of 1500 kΩ for the first years of operation. GI values below 1500 kΩ are detected extremely rarely in the early period. Please note that this limit is most likely determined by the inverter configuration and settings, and probably needs to be adapted for other PV systems.


    FIGURE 4: Original data along time-axis for various inverters with known BS composition (Table 3), PA-based BSs in invA and invB, SF-BS in invC to invF. Dashed lines mark GI = 1500 kΩ

    Then, some inverters start to show a slight but continuous drop in GI, while for others, a strong, temporal GI drop is observed. Figure 4 gives insights in the performance of six selected inverters with respect to BS-type, module type, and temporal performance.

    Figure 5 exhibits the performance linked to T, RH, and AH for inverters with module type G and module Type D. These include InvA: mix of PA-based BSs and FC-based BSs; invB: purely PA-based BSs; and invC to invF: purely SF-BS with a mixture of PVF-, PVDF-, and FC-based SF-BSs.


    GI evolution with respect to temperature, relative and absolute humidity for two time periods (early and late periods) and two module types, respectively two BS-types. Solid lines mark the baseline of all inverters, coloured and dashed lines indicate inverters with known BS material. Bold lines highlight the previously introduced inverters invA to invF

    For visualisation of the weather impact on GI performance, the dataset is split in two periods: the early period covers the years 2013 to 2016 and the late period includes the years 2017 to 2020. Data are aggregated by calculating the median per period and bin (of T, RH, and AH) for each inverter.

    In the early period, the distribution is narrow and similar for both PV module types. The absolute values are lower for PA-based PV modules G. There is a negative trend of GI for T and AH and positive correlation with RH. The majority of inverters perform at the lower values, visible by the accumulation of the curves. With beginning of 2018, GI curves fan out for PV Module D. That means that at low T and high RH, both extremely low and remaining high values exist, see also Table 4. Same observations are described in Buerhop-Lutz et al. for operation voltage of strings. For AH, a local minimum, a bump, is found at approximately 5 g/m3. The reason for this bump is probably that on the one hand the number of days with AH < 4 g/m3 is small, on the other hand the distribution of GI increased, respectively, the days with low GI values. At AH = 5 g/m3 the number of counts is at a maximum with 221 days from 1461 days. At AH < 4 g/m3 only 7 to 89 days per bin are obtained. Because of the low number of days, the late GI reduction might be masked in the median, especially since the last date with AH < 4 g/m3 was registered in April 2020. More investigations are needed for clarification. While PV modules D with SF-BSs show a strong dependence on weather conditions, the PV modules G with PA-based BS remain almost unaffected.


    TABLE 4.

    Percentiles of GI-values for conditions with maximum variance for inverters with Module G (predominantly PA-based BSs) as well as for ones with PV Module D (FC-based SF-BSs)

    Module G PA-based Module D FC-based
    Percentiles 5% 50% 95% 95%–5% 5% 50% 95% 95%–5%
    2013–2016 GI at T = 0°C 4448 5188 7315 2866 4612 5753 8783 4172
    GI at RH = 95% 3462 3859 5387 1925 3796 4722 7369 3573
    GI at AH = 5 g/m3 3942 4658 6437 2494 4220 5116 7729 3509
    2017–2020 GI at T = 0°C 2827 4280 6670 3843 2439 4576 8746 6303
    GI at RH = 95% 1545 3045 4548 3003 1036 3436 8343 7307
    GI at AH = 5 g/m3 2469 3932 5589 3119 2245 4360 8260 6015

    Table 4 summarises GI values for module types D and G for conditions with extreme values. In order to take into account possible outliers, the 5% and 95% percentiles are evaluated. Inverters with PV modules G perform similar within the defined periods but on a reduced GI level and a slightly increased span. For inverters with PV modules D, the span is much larger, and for the second time period, the span increased by a factor to two, the lower bounds decreasing stronger than the upper bounds. In combination with the differing trends in the Figure 5, we conclude more heterogeneous BS-distribution for inverters with PV modules D.

    For studying a potential linear correlation between GI and T, RH, AH, we calculated Pearson's correlation coefficient ρGI,T, ρGI,RH, and ρGI,AH. For a positive linear correlation applies ρ > 0, while for a negative linear correlation ρ < 0.

    For the early period ρGI,T, ρGI,RH, and ρGI,AH are clearly correlated, maxima are at ρGI,T ≈ −0.95, ρGI,RH ≈ +0.75, ρGI,AH ≈ −0.95, independent on the PV module type and BS material (Figure 6). With the onset of measurable changes in 2018, the linear correlation changes significantly. As the curves show, the divergence of GI increases which is also reflected by ρ values. ρGI,T and ρGI,RH spread strongly for low T, respectively for high RH. The resulting ρ distribution ranges from −1 to +1 showing the inversion of the previous trend. The distribution for ρGI, AH broadens, too, but remains mostly negative. For ρGI,RH, an ambivalent behaviour is observed; some inverters still have the positive relationship between GI and T, while for others, the dependence reverses to negative. This observation supports the conclusion of heterogeneous mix BS materials used for PV modules D.


    FIGURE 6: Distribution of Pearson's correlation coefficients ρGI,T, ρGI,RH, and ρGI,AH as well as their averaged values, (a) module type G—early period, (b) module type G—late period, (c) module type D—early period, and (d) module type D—late period, module type D (mainly FC-based BS), module type G (mainly PA-based BS). For calculating ρGI,AH data above AH > 3 g/m3 were evaluated.

    For capturing RH-driven kinetics of GI evolution during operation time, periods of humid days (RH = 90%–95%) and dry days (RH = 40%–45%) are extracted and aggregated to monthly data, see Figure 7. In the first years, GI is highly independent of humidity. For inverters with PA-based BSs GI drops continuously, for humid as well as for dry days. After 4 years of operation, minimum GI is reduced by 10%–17%, after 8 years by 60%–79% of the GI mean in 2013 (first year of operation).


    FIGURE 7: GI evolution for humid (RH = 90%–95%) and dry days (RH = 40%–45%) aggregated to monthly data for inverters with mainly PA- and FC-based BS; humid periods are marked by filled symbols, dry periods by unfilled symbols and lines to guide the eyes

    Inverters with FC-based BSs show a similar humidity-independent performance until 2018 (fifth year of operation). Thereafter, GI drops drastically by one order of magnitude on humid days, being still high on dry days. In case of inverters with mixed PA-based and FC-based BSs (invA in Figure 7a), GI values on dry and humid days start to diverge after 2018, less than pure SF-BSs, but stronger than pure PA-based BSs.


    When the GI decreases over the years, critical values below 400 kΩ can be achieved. Such low GI values were measured for more than 20% of the inverters in 2020 (year eight of operation), see Figure 8. About 50 inverters of inverter configurations III and IV (more FC-based SF-BSs) are affected strongly in 2020, but the onset can be recognised in 2018. GI of two inverters of inverter configurations VI (more PA-based SF-BSs) fall below 400 kΩ. The BS analysis discloses that these two inverters include PV modules with FC-based SF-BSs.

    FIGURE 8: Fraction of inverters per inverter configuration with GI < 400 kΩ

    The field data reveal that humidity and BS-material distribution within individual inverters are important stress factors for GI reduction, especially for inverters with FC-based SF-BSs. Historic GI data reflect the different BS behaviour and are suitable for high-throughput analysis of multi-MWp PV power stations.

    4 DISCUSSION

    The lab and field examinations of more than 500 PV modules enable differentiating two performance patterns with regard to insulation issues and BS compositions which we will refer to as PA-like performance, and FC-like performance.

    PA-like performance is described by a moderate leakage resistance and moderate LR loss rates for field-aged PV modules with intact BSs. Less water penetrates into the BS and the rate of soaking and drying is slower for PA-based BSs than for FC-based ones. For PA-based BSs, we expect a balanced, water-independent performance with regard to insulation. Please note, while the leakage resistance tests in the lab were carried out with intact PA-based BSs, in the field we found that about 60% of the PA-based BSs were showing severe macroscopic cracks.

    FC-like performance is characterised by a high susceptibility to water and a high leakage resistance loss rate for PV modules after 6–8 years of operation. Water is easily and rapidly absorbed and released by the FC-based BS, which happens when ambient conditions change. As a result, weather-dependent performance variations are expected. With increasing water ingress, the leakage resistance drops strongly. In the lab-based wet leakage resistance tests, LR decreases within 1 h to zero if LR0 is already close to 15 MΩ. The water susceptibility for unused or spare PV modules is smaller than for degraded, field-aged ones, which is also reflected by the GI-evolution with time. Field-aged SF-BSs and FC-based BSs appear macroscopically intact, but on a microscopic scale, plenty of microcracks can be seen in the inner layers as well as corrosion of metal components.

    Historic GI values measured and logged by each inverter for readiness checks reflect these different kinetics for inverters with different BS-types. Publicly available weather data were sufficient to associate GI losses with low ambient temperatures (T < 5°C), high relative humidity (RH = 90%–95%), and low absolute humidity (shown for decrease of GI at AH = 5 g/m3). PA-like performance shows a slow but continuous GI decrease. FC-like behaviour is described by a later but drastic GI drop. While inverters with PV modules with mainly PA-based BSs remain independent on humidity, those with FC-based BSs alternate between low and high GI values depending on humidity and temperature. If inverters simultaneously have PV modules with PA-based and FC-based BSs, GI values react stronger to humidity than for pure PA-based ones and less than pure FC-based ones.

    The risk for GI falling below the critical value of 400 kΩ is high for inverter configurations that include PV modules with FC-based SF-BSs. In 2020, GI values fell below 400 kΩ for several inverters on more than 100 days. Shutdowns occurred on 85 days with RH > 80% as well as on summer days with high humidity in the morning, for which the average daily humidity is much lower. That means in year eight of operation inverter issues are present for already 27% of the days. Of the inverters, 22% show this tendency, trend increasing.

    Countermeasures to ensure inverter operation include removing PV modules with low insulation resistance from the electrical circuit (see invC). These bypassed PV modules had all an FC-based BS. It should be noted that such measures are only a short-term solution, as identical modules may experience the same insulation faults. Furthermore, shortening the string reduces the power output and the repeated exclusion of modules can cause leaving the operating range of the inverter. Performance losses are the consequence.

    5 CONCLUSION

    Water ingress into BSs is a serious issue. We believe it is responsible for frequent inverter shutdowns. This study provides insights into pending insulation issues of inverters, exemplarily shown for a 5-MWp PV power station with 20,530 PV modules and 314 inverters. For BS-identification, on-site NIRA measurements of 518 PV modules from 20 inverters were carried out.

    We observe different kinetics and drops in LR for different BS types and distinguish between two types of behaviour: first, PA-like, characterised by moderate LR resistance loss and more humidity-independent, creeping performance with regard to insulation in the field; and second, FC-like, characterised by high susceptibility to water and a high leakage resistance loss rate for PV modules after 6–8 years of operation. These characteristics are reflected when measuring GI in dependence of temperature and humidity. At low temperature and low absolute humidity the GI is expected to be high. A decreased GI indicates high leakage current due to potential BS issues. For both BSs, we see a reduction in average GI over time, and an increase in instances when GI falls below a critical value of 400 kΩ. For PA-based BSs, the reduction in GI is steady over 8 years. We observe incidences with GI below the critical value on 2.8% of all days for two inverters. For FC-based BSs, we also observe steady decrease of average GI initially, yet after 6 years in the field, we see a sudden and rapid decline for 20% of those inverters. GI falling below the critical value is observed on up to 5% of all days, trend increasing. Instance in which GI fall below the critical value frequently happen on days with high average relative humidity and on summer days with high humidity in the morning.

    For 70% of the inverters, GI will probably drop below 400 kΩ more frequently in the future and cause inverter alerts due to ground faults. Disconnection of such inverters from the grid and feed-in is expected to result in increasing income losses.

    In order to obtain a more complete knowledge of the BS material used, BS analyses in the PV power stations are to be expanded, and automated evaluation procedures for combining measurement data and monitoring data are to be developed.

    SOURCE: https://onlinelibrary.wiley.com/doi/full/10.1002/pip.3481


    View our solar case studies.

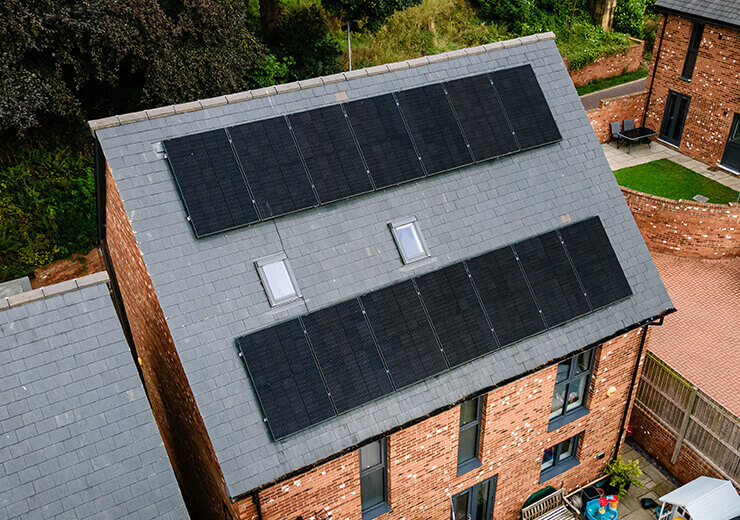
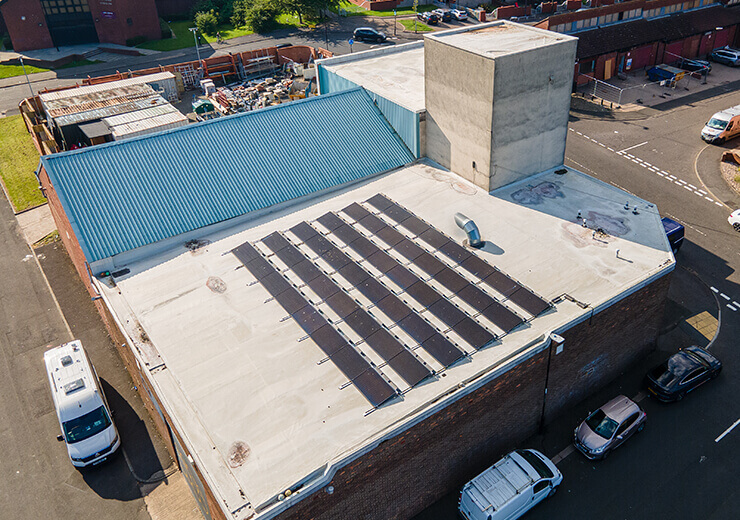
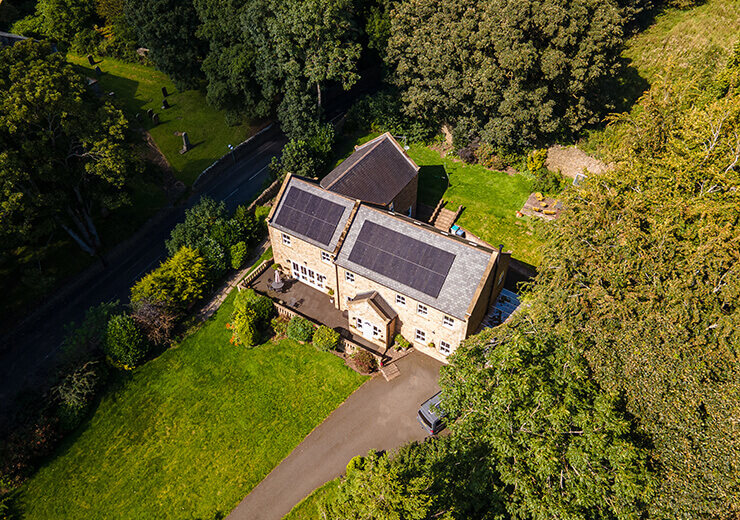
    We've helped homeowners across the North East cut energy bills and reduce carbon emissions with bespoke domestic solar systems, from family homes to larger residential properties. Alongside this, we've delivered projects for schools like Cragside and Dame Dorothy, community hubs such as Kibblesworth Millennium Centre and Alnwick Community Centre, local cafes, churches, and even national brands like Burger King. With major installs for organisations including Darlington College, Phillips Pet Supplies, and Collingwood Healthcare Services, our portfolio shows proven expertise across both domestic and commercial solar - providing tailored installations that deliver long-term savings and sustainability.

    Ready to switch to solar? Request a quote.

    To design and size your solar and/or battery system correctly, we need to know your annual kWh usage. This allows us to create a system that accurately matches your energy needs - reducing the electricity you buy from the grid, lowering your carbon footprint, and protecting you from rising energy costs so you save as much money as possible.

    Rated best in North England by the Independent.


    Independent Logo

    "Sustainable Energy Engineering is based in North England and offers a comprehensive solar panel installation service. The family-run business has more than 20 years of experience and is TrustMark registered, which means homeowners who are taking advantage of the UK's solar incentives can use Sustainable Energy Engineering as their certified installed."


    Meet the Team


    Your local trusted solar panel installer.

    With hundreds of five-star reviews since 2006, Sustainable Energy Engineering has built a reputation for quality, honesty, and reliability. Unlike many short-lived installers, we're here for the long haul - ready to support you long after installation. That's why so many customers choose us after their original installer disappears. Choose us for peace of mind, fair pricing, and expert solar solutions that last.