
How Many kWh Does a Solar Panel Produce?
Author: Steve Fairless
Originally Published: 6th February 2024 · Updated: 3rd September 2026
A solar panel does not have one fixed daily or annual kWh output. Its watt rating tells us its maximum DC power under standard test conditions; the energy it produces over a day or year depends on sunlight, location, orientation, pitch, shade, temperature and system losses. A current 500 W module is therefore not a panel that produces 0.5 kWh every hour of daylight.
At Sustainable Energy Engineering, we forecast annual generation from the complete array in kWp, then model the roof and site. We do not multiply panel wattage by an assumed number of “sun hours” and present that as a guaranteed UK result.
This guide explains the difference between W, kW, kWh and kWp, how to turn a panel count into an array size, and how we sense-check expected annual output.
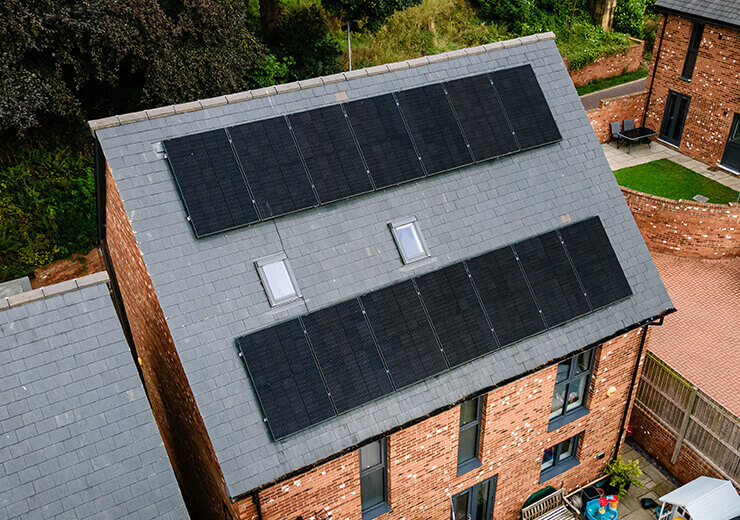
For a home design, our solar PV for home assessment uses the real roof layout and energy demand rather than a universal kWh-per-panel claim.
Updated: 3rd September 2026
Solar Panel kWh Output: The Short Answer
- Panel wattage is power; kWh is energy over time. A 500 W panel has a 0.5 kW nameplate rating under standard test conditions.
- Annual kWh depends on the site. The same module will generate different energy on different roofs and in different parts of the UK.
- Model the array in kWp first. Ten 500 W modules make a 5.0 kWp DC array.
- Orientation, pitch and shade matter. They change how much irradiation reaches the modules and when generation occurs.
- Use annual yield modelling rather than a fixed daily figure. Daily averages hide the very large seasonal difference between summer and winter.
Watts and kilowatt-hours answer different questions
| Measure | Meaning | Solar example |
|---|---|---|
| W / kW | Instantaneous electrical power. | A 500 W module is rated at 0.5 kW under standard test conditions. |
| kWp | The summed peak DC rating of the array. | Ten 500 W panels = 5.0 kWp. |
| kWh | Energy produced or consumed over time. | If a system delivered 3 kW continuously for two hours, that would be 6 kWh. |
Confusing these units is one of the main reasons online solar-output estimates become misleading. The panel rating is not a promise that the module will sit at that output throughout the day.
A real current panel example
AIKO's current 2026 Neostar 3P54 range includes modules from 470 W to 500 W in a 1762 x 1134 mm format. That tells us the module's rated DC power and physical size. It does not tell us the annual kWh from a roof in Washington, Newcastle, London or Aberdeen.
How we move from panel wattage to annual kWh
We first total the module ratings to get array kWp. We then apply site-specific information: location, roof orientation, inclination, shading and system characteristics. PVGIS can provide an independent model of photovoltaic output for a selected location and configuration, which is useful for checking whether a forecast is in the right range.
Worked example - why the yield assumption matters
Suppose a roof has ten 500 W modules: the array is 5.0 kWp. If a site-specific model produced a hypothetical annual yield of 850 kWh per installed kWp, the array would be about 4,250 kWh/year, or an average of 425 kWh per panel. The 850 figure here is an example for the calculation, not a UK-wide promise. A different roof could be materially higher or lower.
Why there is no reliable “kWh per panel per day” UK number
A yearly average divides winter and summer into one smooth figure. Real PV output does not behave like that. A clear summer day can produce several times the energy of a dark winter day, and prolonged cloud, snow cover or shading can reduce individual days further.
For bill modelling, annual and monthly generation profiles are far more useful than a statement such as “each panel makes 2 kWh every day”. We want to know both how much energy is likely and when it is likely.
Location changes solar irradiation
UK solar potential varies geographically. A southern site generally receives more annual irradiation than a northern site, but roof orientation, shading and local horizon can sometimes create a larger difference than postcode alone. This is why we model the actual site.
Orientation changes both annual output and timing
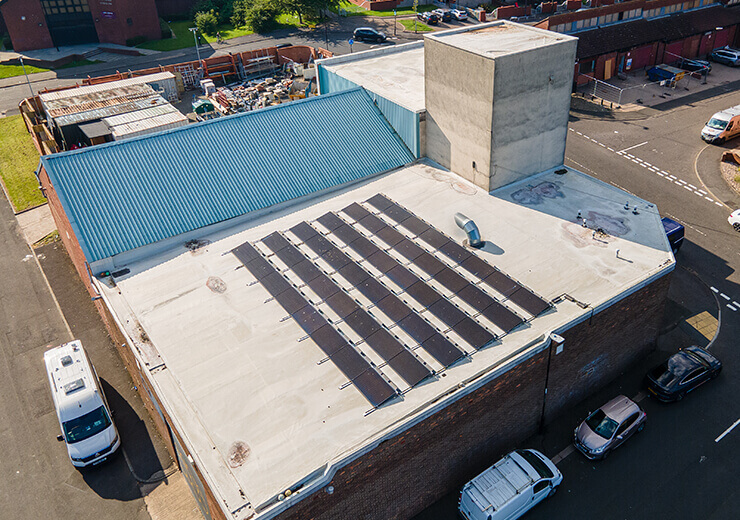
A south-facing array tends to concentrate generation around the middle of the day. East-facing modules generate earlier and west-facing modules later. An east-west design can trade some annual peak yield for a broader production window that may align better with household or business demand.
Pitch changes the solar angle through the seasons
Roof inclination affects the angle at which sunlight reaches the module and therefore the annual energy captured. We do not try to force every roof to a theoretical “perfect” angle if the existing pitch already produces a strong practical design. Extra frames can add cost, wind loading, shading between rows and planning considerations.
Shade can reduce more than the shaded area suggests
Chimneys, trees, dormers, neighbouring buildings and roof geometry can create persistent or seasonal shade. The electrical impact depends on string layout, bypass diodes, MPPT arrangement and any module-level electronics. A kWh forecast should account for the actual shaded periods rather than applying a token loss percentage.
Temperature affects instantaneous power
Solar modules are rated under laboratory standard test conditions. In bright hot weather, cell temperature can rise above those conditions and reduce instantaneous voltage/power. Cooler bright conditions can be very productive. Annual models account for real operating conditions rather than assuming nameplate power all day.
Inverter and system losses reduce AC energy
The modules generate DC electricity, but the home uses AC. Inverter conversion, cabling, clipping, mismatch, standby consumption and availability all affect the usable AC energy. A credible annual figure therefore needs to represent the whole system, not just module efficiency.
Panel count is not the performance target
We design around useful annual and time-of-day generation. Twelve lower-wattage modules on a better roof plane can outperform a smaller number of high-wattage modules that are squeezed into persistent shade.
How to compare output claims from two quotes
- Compare the total installed kWp, not just panel wattage.
- Check the roof planes, orientation, pitch and shading assumptions.
- Ask whether the forecast is annual AC energy after system losses.
- Check whether inverter clipping or export limitation changes the usable result.
- Ask for the monthly profile if battery sizing or self-consumption is important.
What we recommend
Use the panel wattage to define array size, then use a proper site model to answer the kWh question. The useful figure for a customer is not “what can this panel do in a laboratory?” but “what should this complete system produce on this roof, through a real UK year?”
Want a Generation Estimate for Your Actual Roof?
We can model array size, orientation, pitch and shading and explain the expected annual and seasonal generation before equipment is specified.
Request a tailored quote from Sustainable Energy Engineering.